Credit scoring with self-organizing maps
What structure does a self-organizing map reveal, and how do supervised baselines perform on held-out credit records?
Self-directed study
One split of a small historical dataset. The result does not establish fairness or suitability for lending decisions.
The evidence
Fig. 01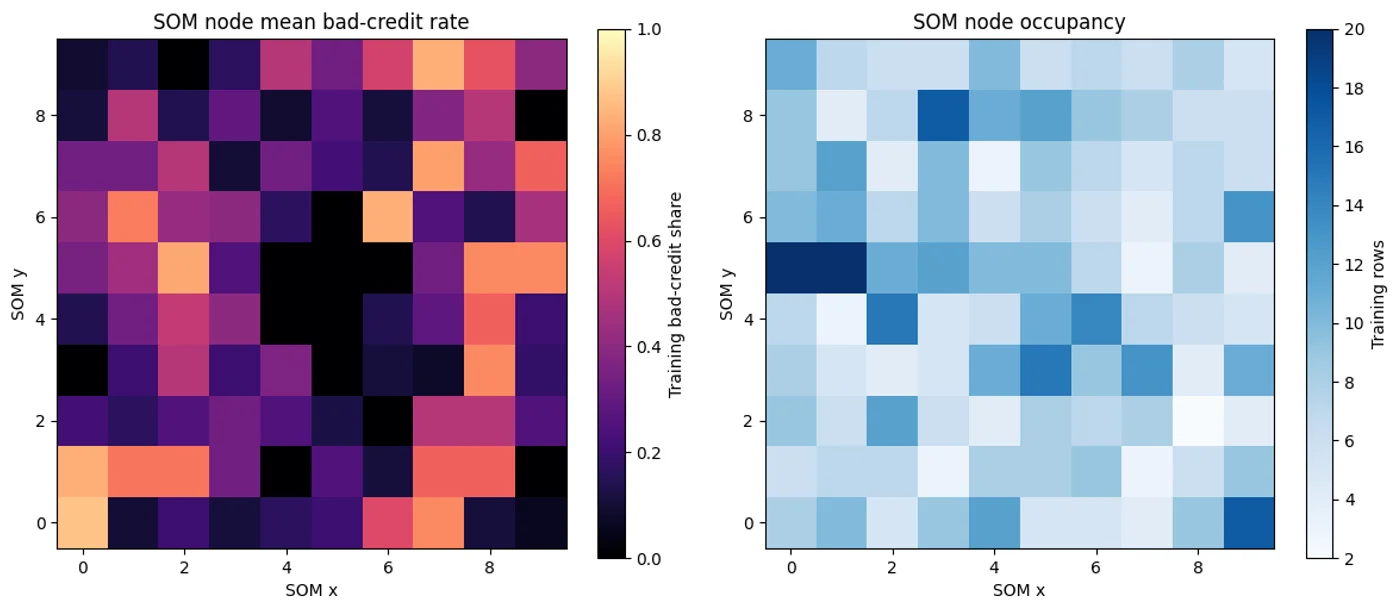
01 · Method and interpretation
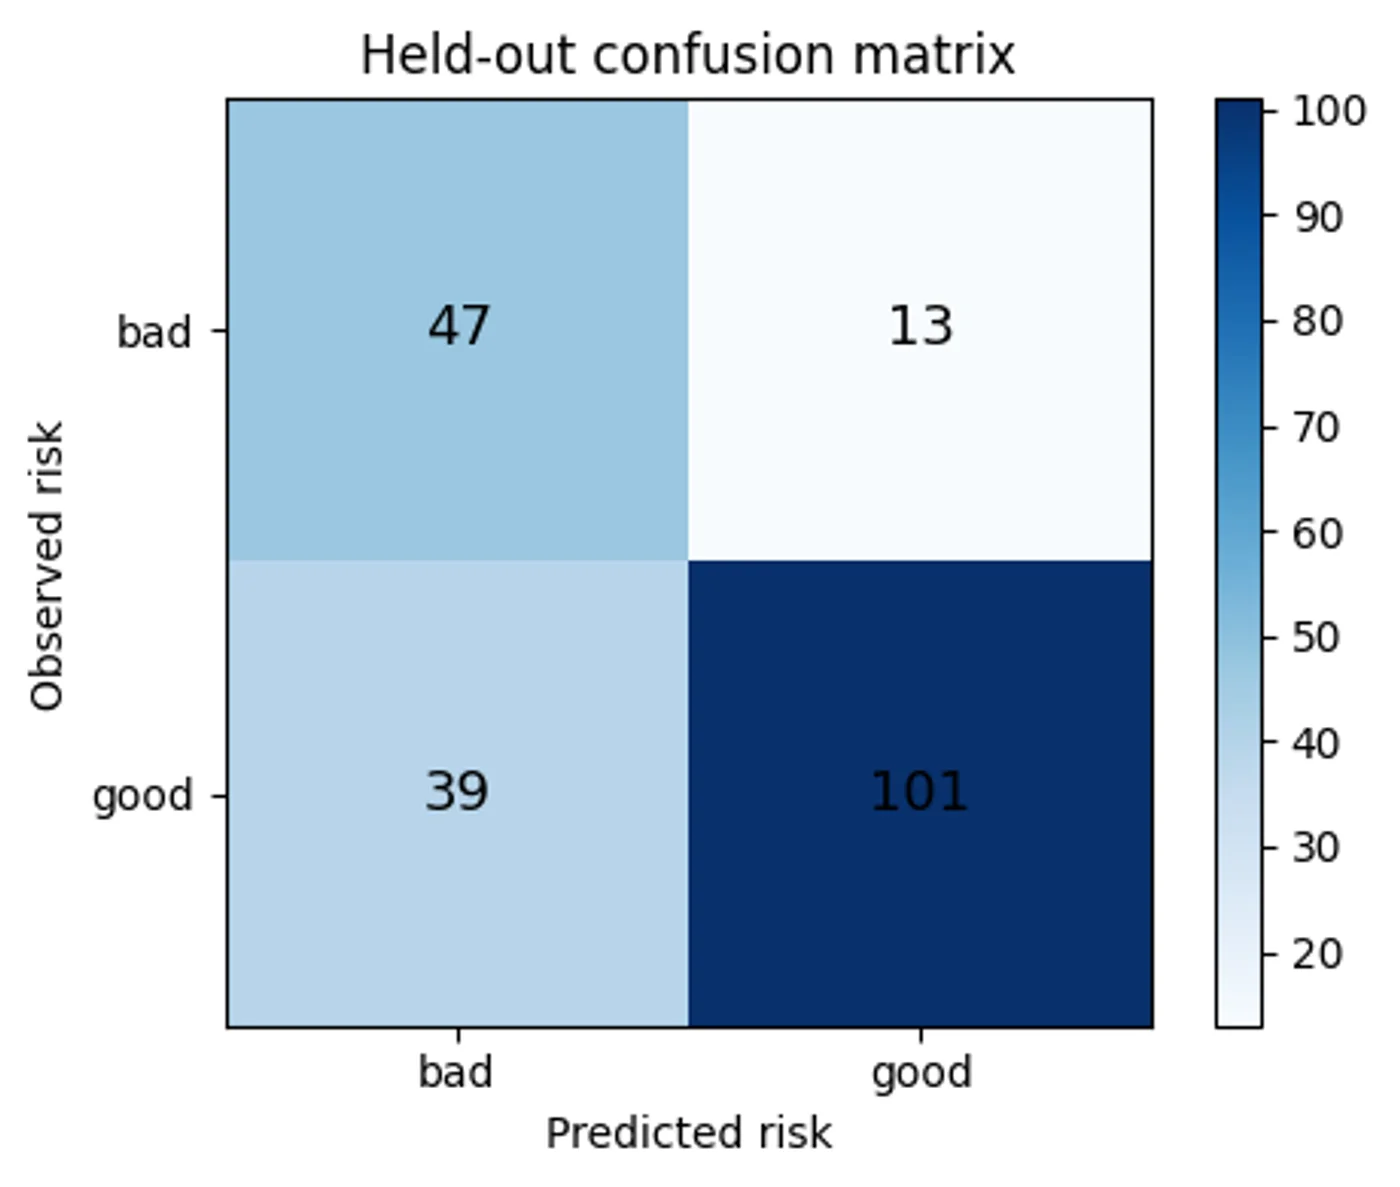
A 10×10 self-organizing map explores profiles in UCI’s corrected South German Credit data, followed by supervised baselines on one stratified held-out split. The same training-fitted scaling is applied to test rows, and the personal-status/sex and foreign-worker fields are excluded. Balanced logistic regression reaches 75.2% balanced accuracy and 78.3% bad-risk recall, but this small historical dataset and one-split result are not suitable for lending decisions or evidence of fairness.
02 · Supporting figures
Selected outputs from the complete notebook.